Probabilistic Graphical Models
A graphical model is a method for modeling probability distributions under certain uncertainty.
Toolbox:
- Representation: model uncertainty and encode domain knowledge
- Inference: answer questions \(P(X\mid m)\), where m is the model or data
- Learning: what model fits my data \(m = \operatorname*{argmax}_{m\in M} F(D,m)\).
Benefits:
-
Efficient
- (Expensive) The chain rule (aka product rule) allows to calculate joint probabilities.
- (Cheaper) Using GM, we can model only those dependencies inferred by the graph, generating fewer parameters; encodes independence.
-
Encode domain knowledge through priors and incorporate them in inference via Bayes theorem.
GMs vs PGMs:
- GMs use multivariate function.
-
PGMs use multivariate distributions.
Structure
- Edges represent relationship among the RVs.
- Directed nodes represent causality while undirected nodes represent correlation.
Bayesian Network and Markov Random Field
Bayesian Network
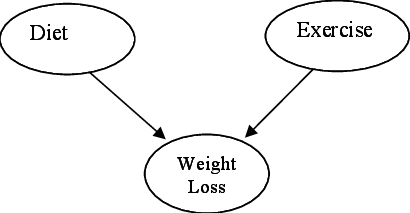
- It is a directed acyclic graph (DAG) where each node has a Markov blanked (its parents, children and children’s parents).
- A node is conditionally independent of the nodes outside its Markov Blanket.
- Joint probability distribution is determined by the local conditional probabilities as well as the graph structure.
- Model can be used to generate new data.
Markov Random Field
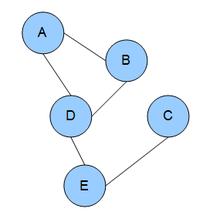
- It is an undirected graph.
- A node is conditionally independent of the other graph nodes, except for its immediate neighbors.
- To determine the joint probability distribution, we need to know local contingency functions (potentials) as well as structural cliques.
- This model cannot explicitly generate new data.